Back to Projects
TradeTracker
A trading journal that scores the process as well as the P&L
Project Summary
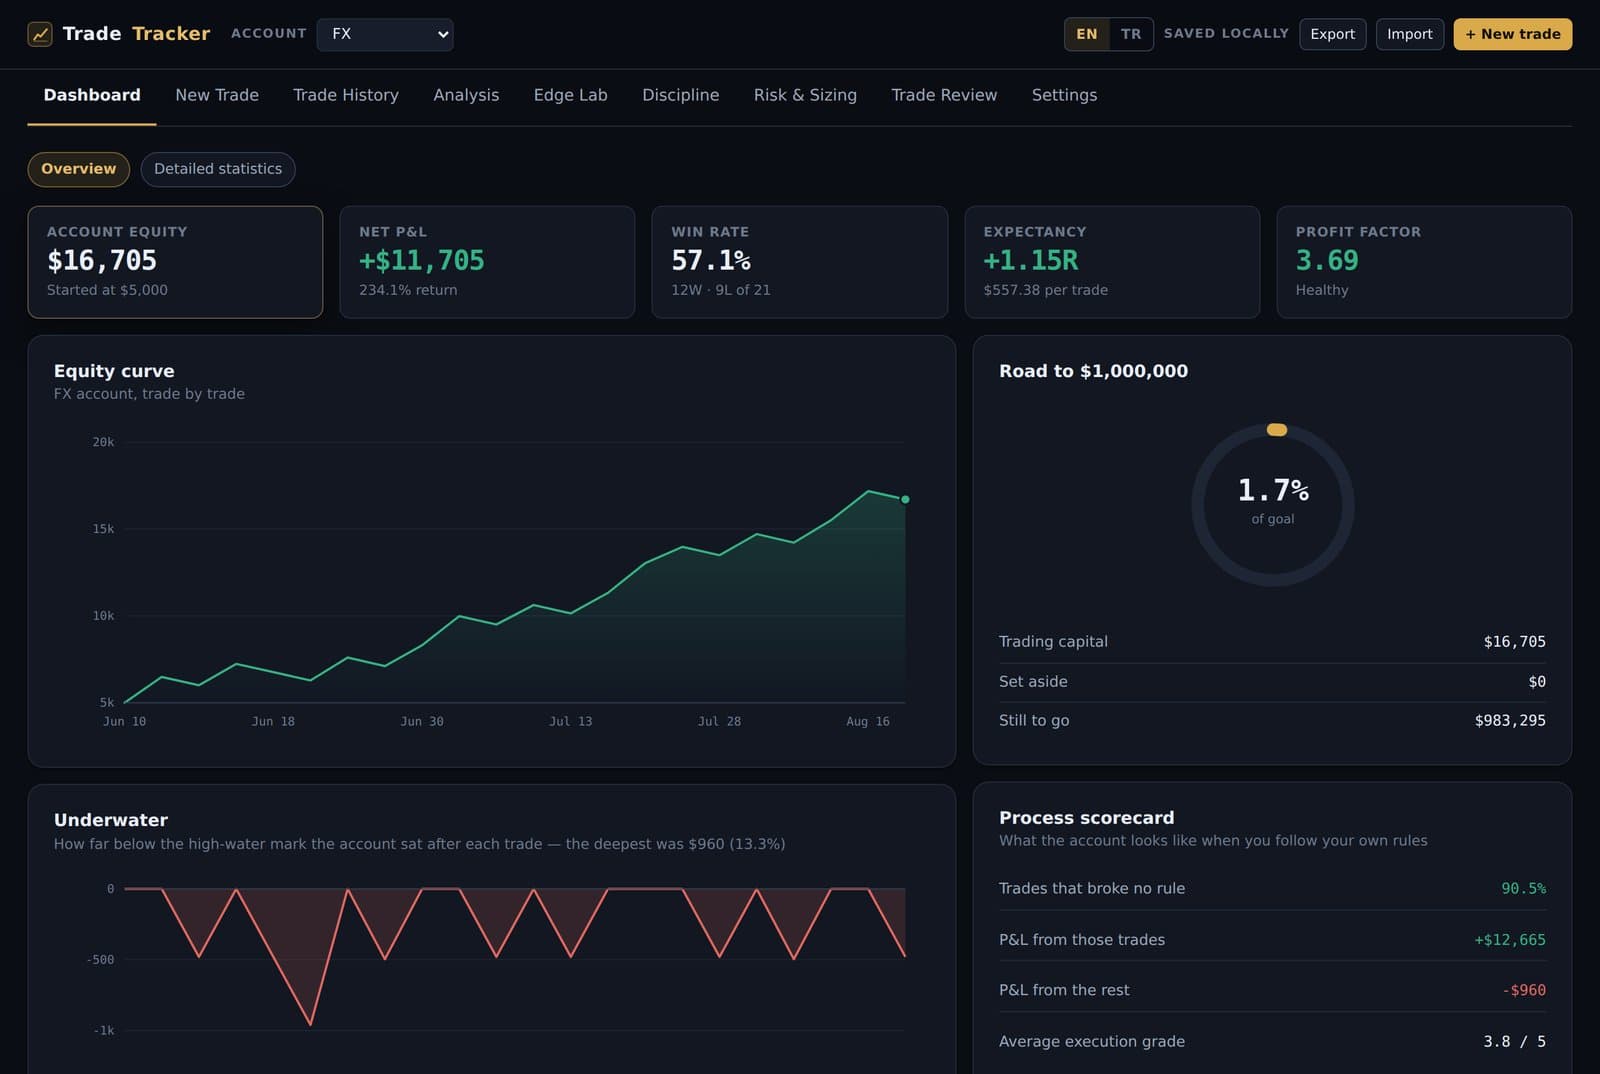
Most journals tell you what you made. TradeTracker also shows what following your own rules is worth: it flags trades taken outside the plan, redraws the account without them and measures the gap.
It is written in plain HTML, CSS and JavaScript with no framework, bundler or server; all data stays in the browser and no account is needed.
Features
- Dashboard: equity curve, underwater plot, goal tracking and a daily P&L calendar
- Edge Lab: R-multiple distribution, expectancy, a Monte Carlo that resamples your own results to estimate risk of ruin, session/hour breakdowns and MAE/MFE analysis
- Discipline: every trade is scored against your own rules (unplanned, inside the post-loss cooldown, past the daily cap, wrong size) and the account is redrawn with those trades removed
- Risk and sizing: position size from entry, stop and risk percentage; contract sizes for forex, gold, indices, stocks and crypto; Kelly from your own stats once there are enough trades
- Trade review: before/after chart screenshots, the written plan and the lesson learned
- English and Turkish interface
Technical Details
- Every chart is hand-drawn SVG with no charting library
- Trades live in localStorage; screenshots go to IndexedDB so they never fill the quota
- Checksummed JSON backups for moving to another machine, with merge or replace on import
- Calculations are checked against hand-computed values, and backups with a byte-for-byte round-trip test
Technologies Used
JavaScriptHTML/CSSSVGIndexedDBlocalStorageMonte Carlo simulation